StepZen Dashboard: New sample queries and other improvements

 Samuel Hill
We're thrilled to release a new look and new capabilities for your StepZen Dashboard (your My StepZen experience). Visit dashboard.stepzen.com to check out the new dashboard for yourself.
What's New?
The dashboard provides the same endpoint analytics you've been using since the initial dashboard release in July. You can read about these analytics in the StepZen Dashboard Analytics blog.
To give you insights on the performance of your GraphQL API and to make it easier to get building, we've built two new key features into the StepZen Dashboard.
Also with this release, we provide a better user experience and more resources for scaling the endpoints you build on StepZen. Easily accessible examples, documentation, samples and networking with the StepZen team are now provided for all StepZen accounts. Select an example to jump start your StepZen project - then we hope that easy access to StepZen documentation and to the StepZen technical team with any questions or comments throughout your project will get you up and running faster than ever.
The Features
The dashboard has three pages to help with your GraphQL development experience.
Endpoints Page
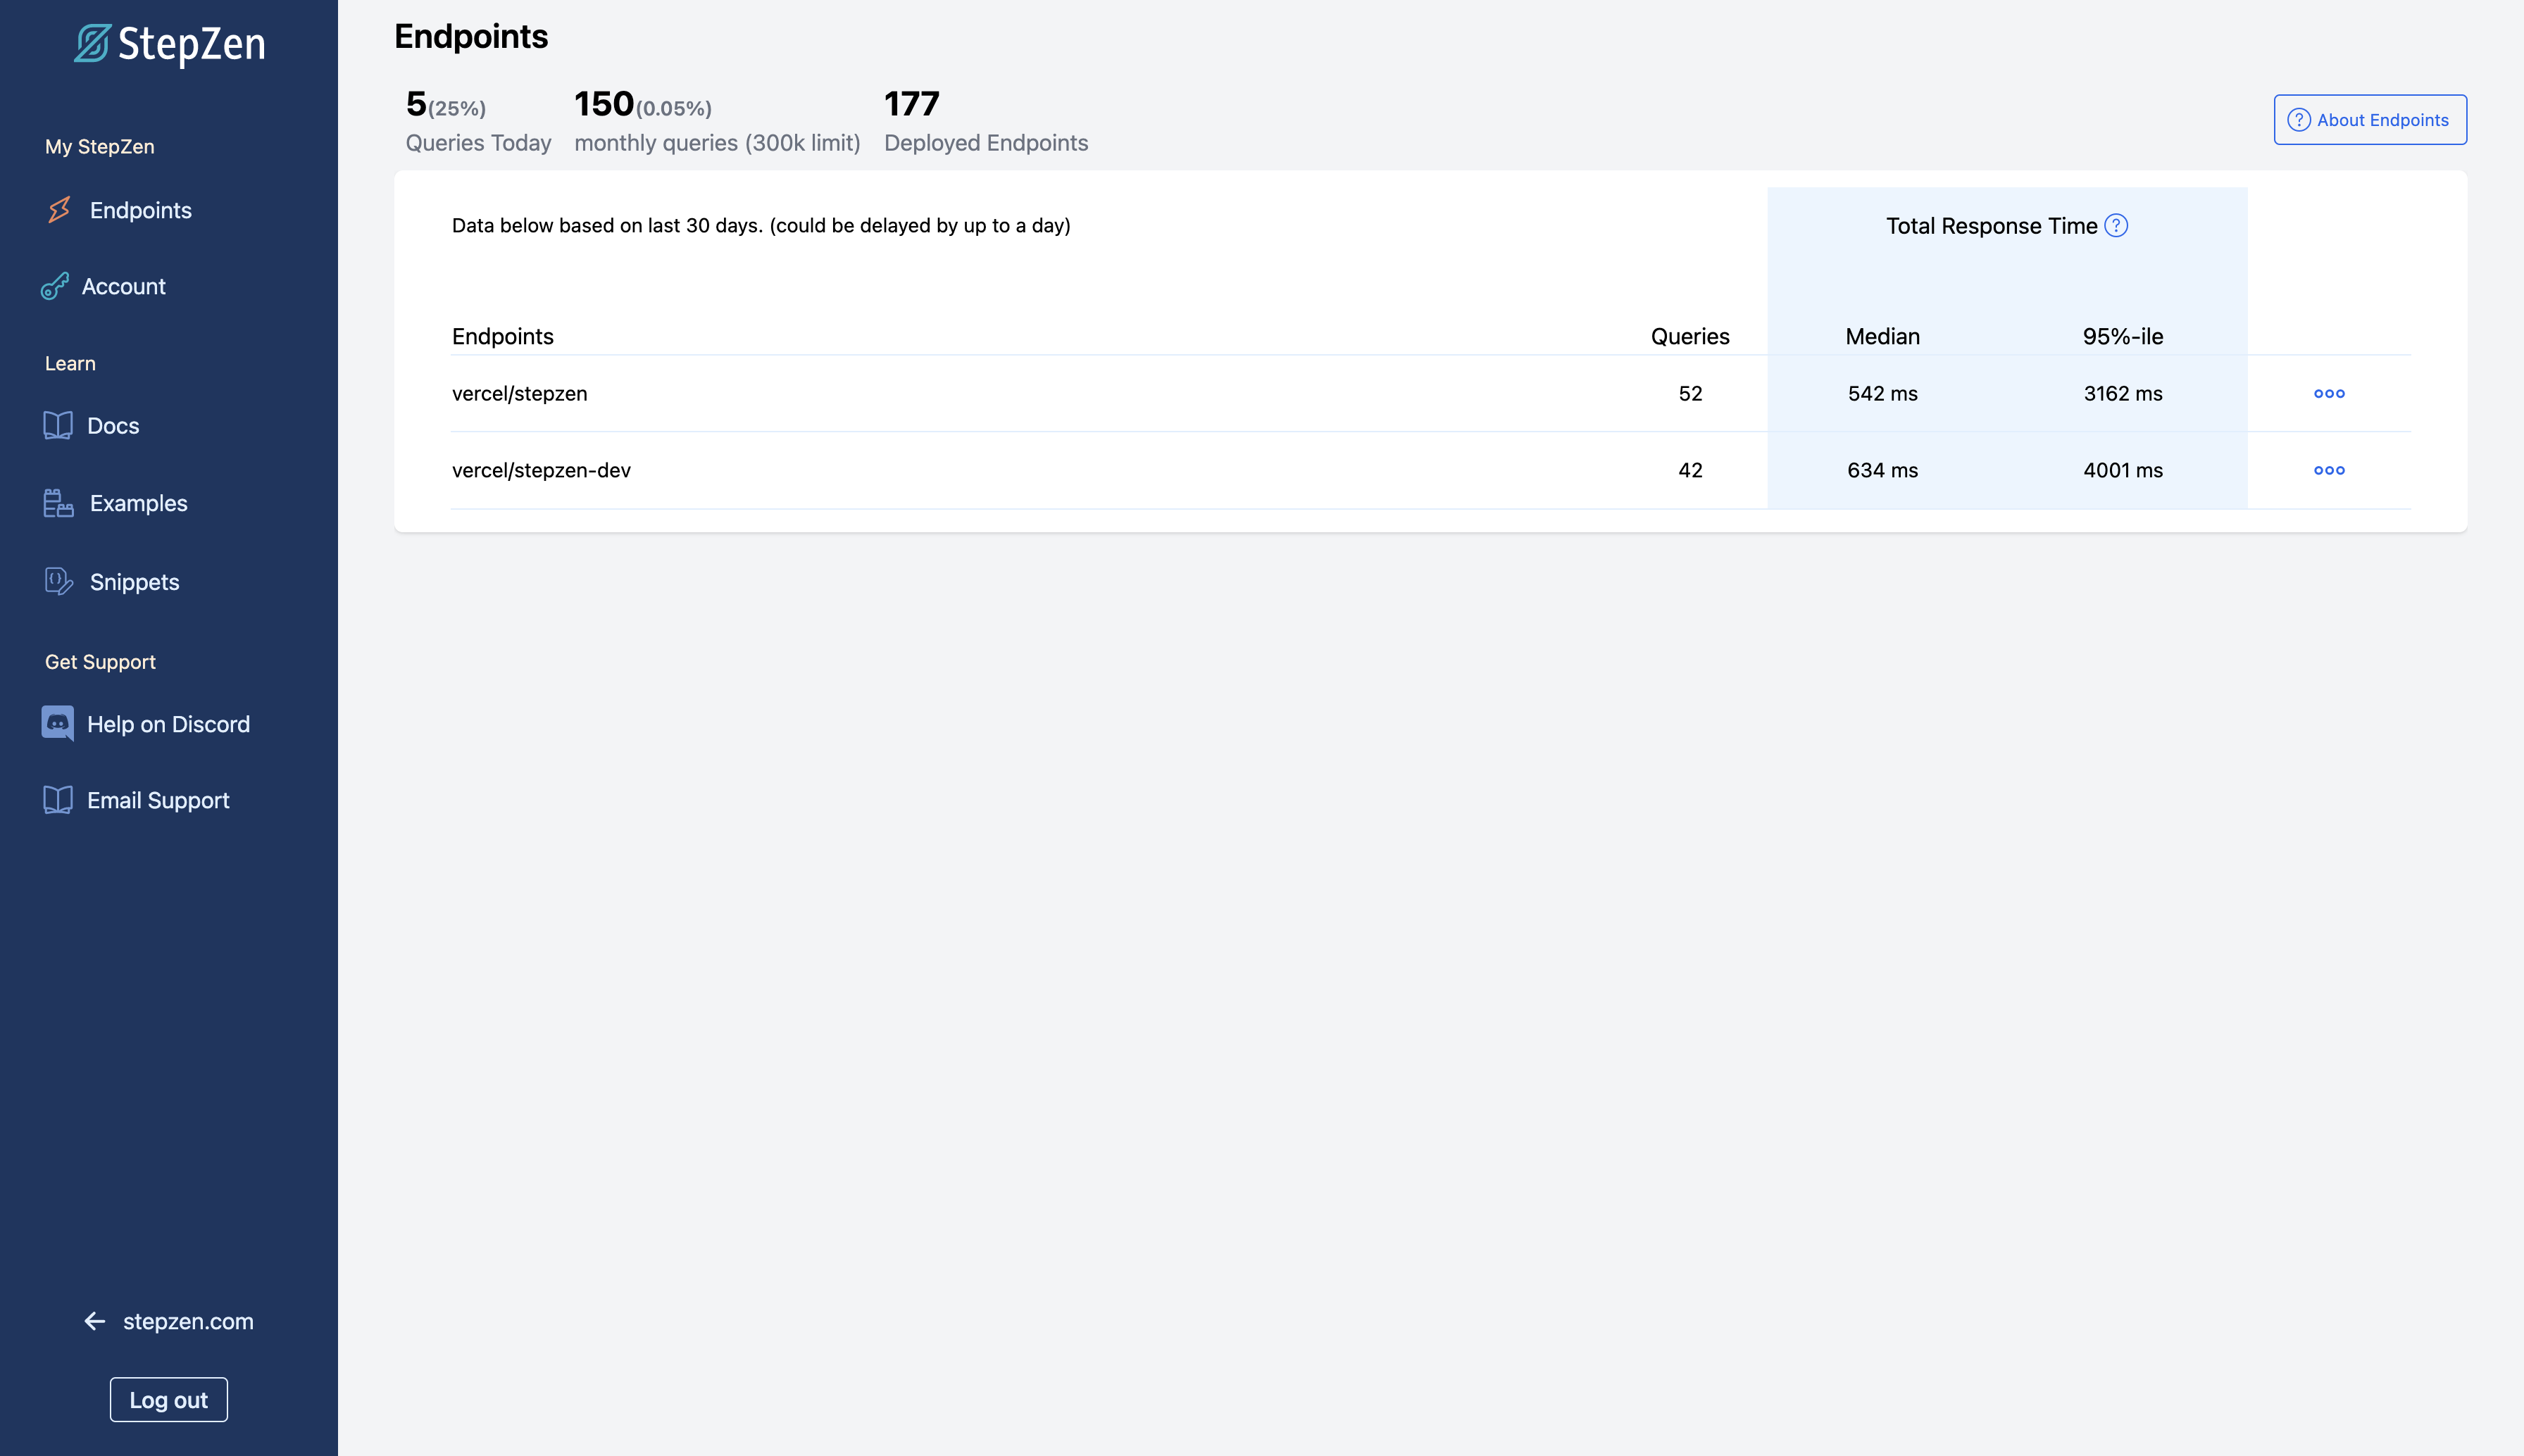
As shown in the image above, the endpoints page displays all of the endpoints that you have deployed. This page provides three distinct metrics for each individual endpoint along with account totals.
-
Queries The total number of queries run against an endpoint.
-
Median Response Time 50% of queries have higher latency and 50% of queries have lower latency than this value. It can also be referred to as the 50% latency.
-
95 Percentile (95%-ile) Response Time 95% of queries have lower latency than this value and 5% have higher latency. If performing properly, this number should have a higher value than the Median Response Time.
Every query made to an endpoint, local or production requests, is collected in these metrics. Requests made to your endpoint outside of the local proxy are optimized for faster responses. This is thanks to the caching layer provided by the StepZen GraphQL Engine.
We purposely do not use this caching layer in the local proxy to ensure you get proper development experiences. If you are seeing higher than expected GraphQL queries for an endpoint, consider making more requests outside of the local proxy to reap the benefits of the StepZen GraphQL Engine caching optimization.
Don't see any GraphQL endpoints in your StepZen Dashboard? That's okay! Go to Getting Started to build an endpoint today.
Account Page
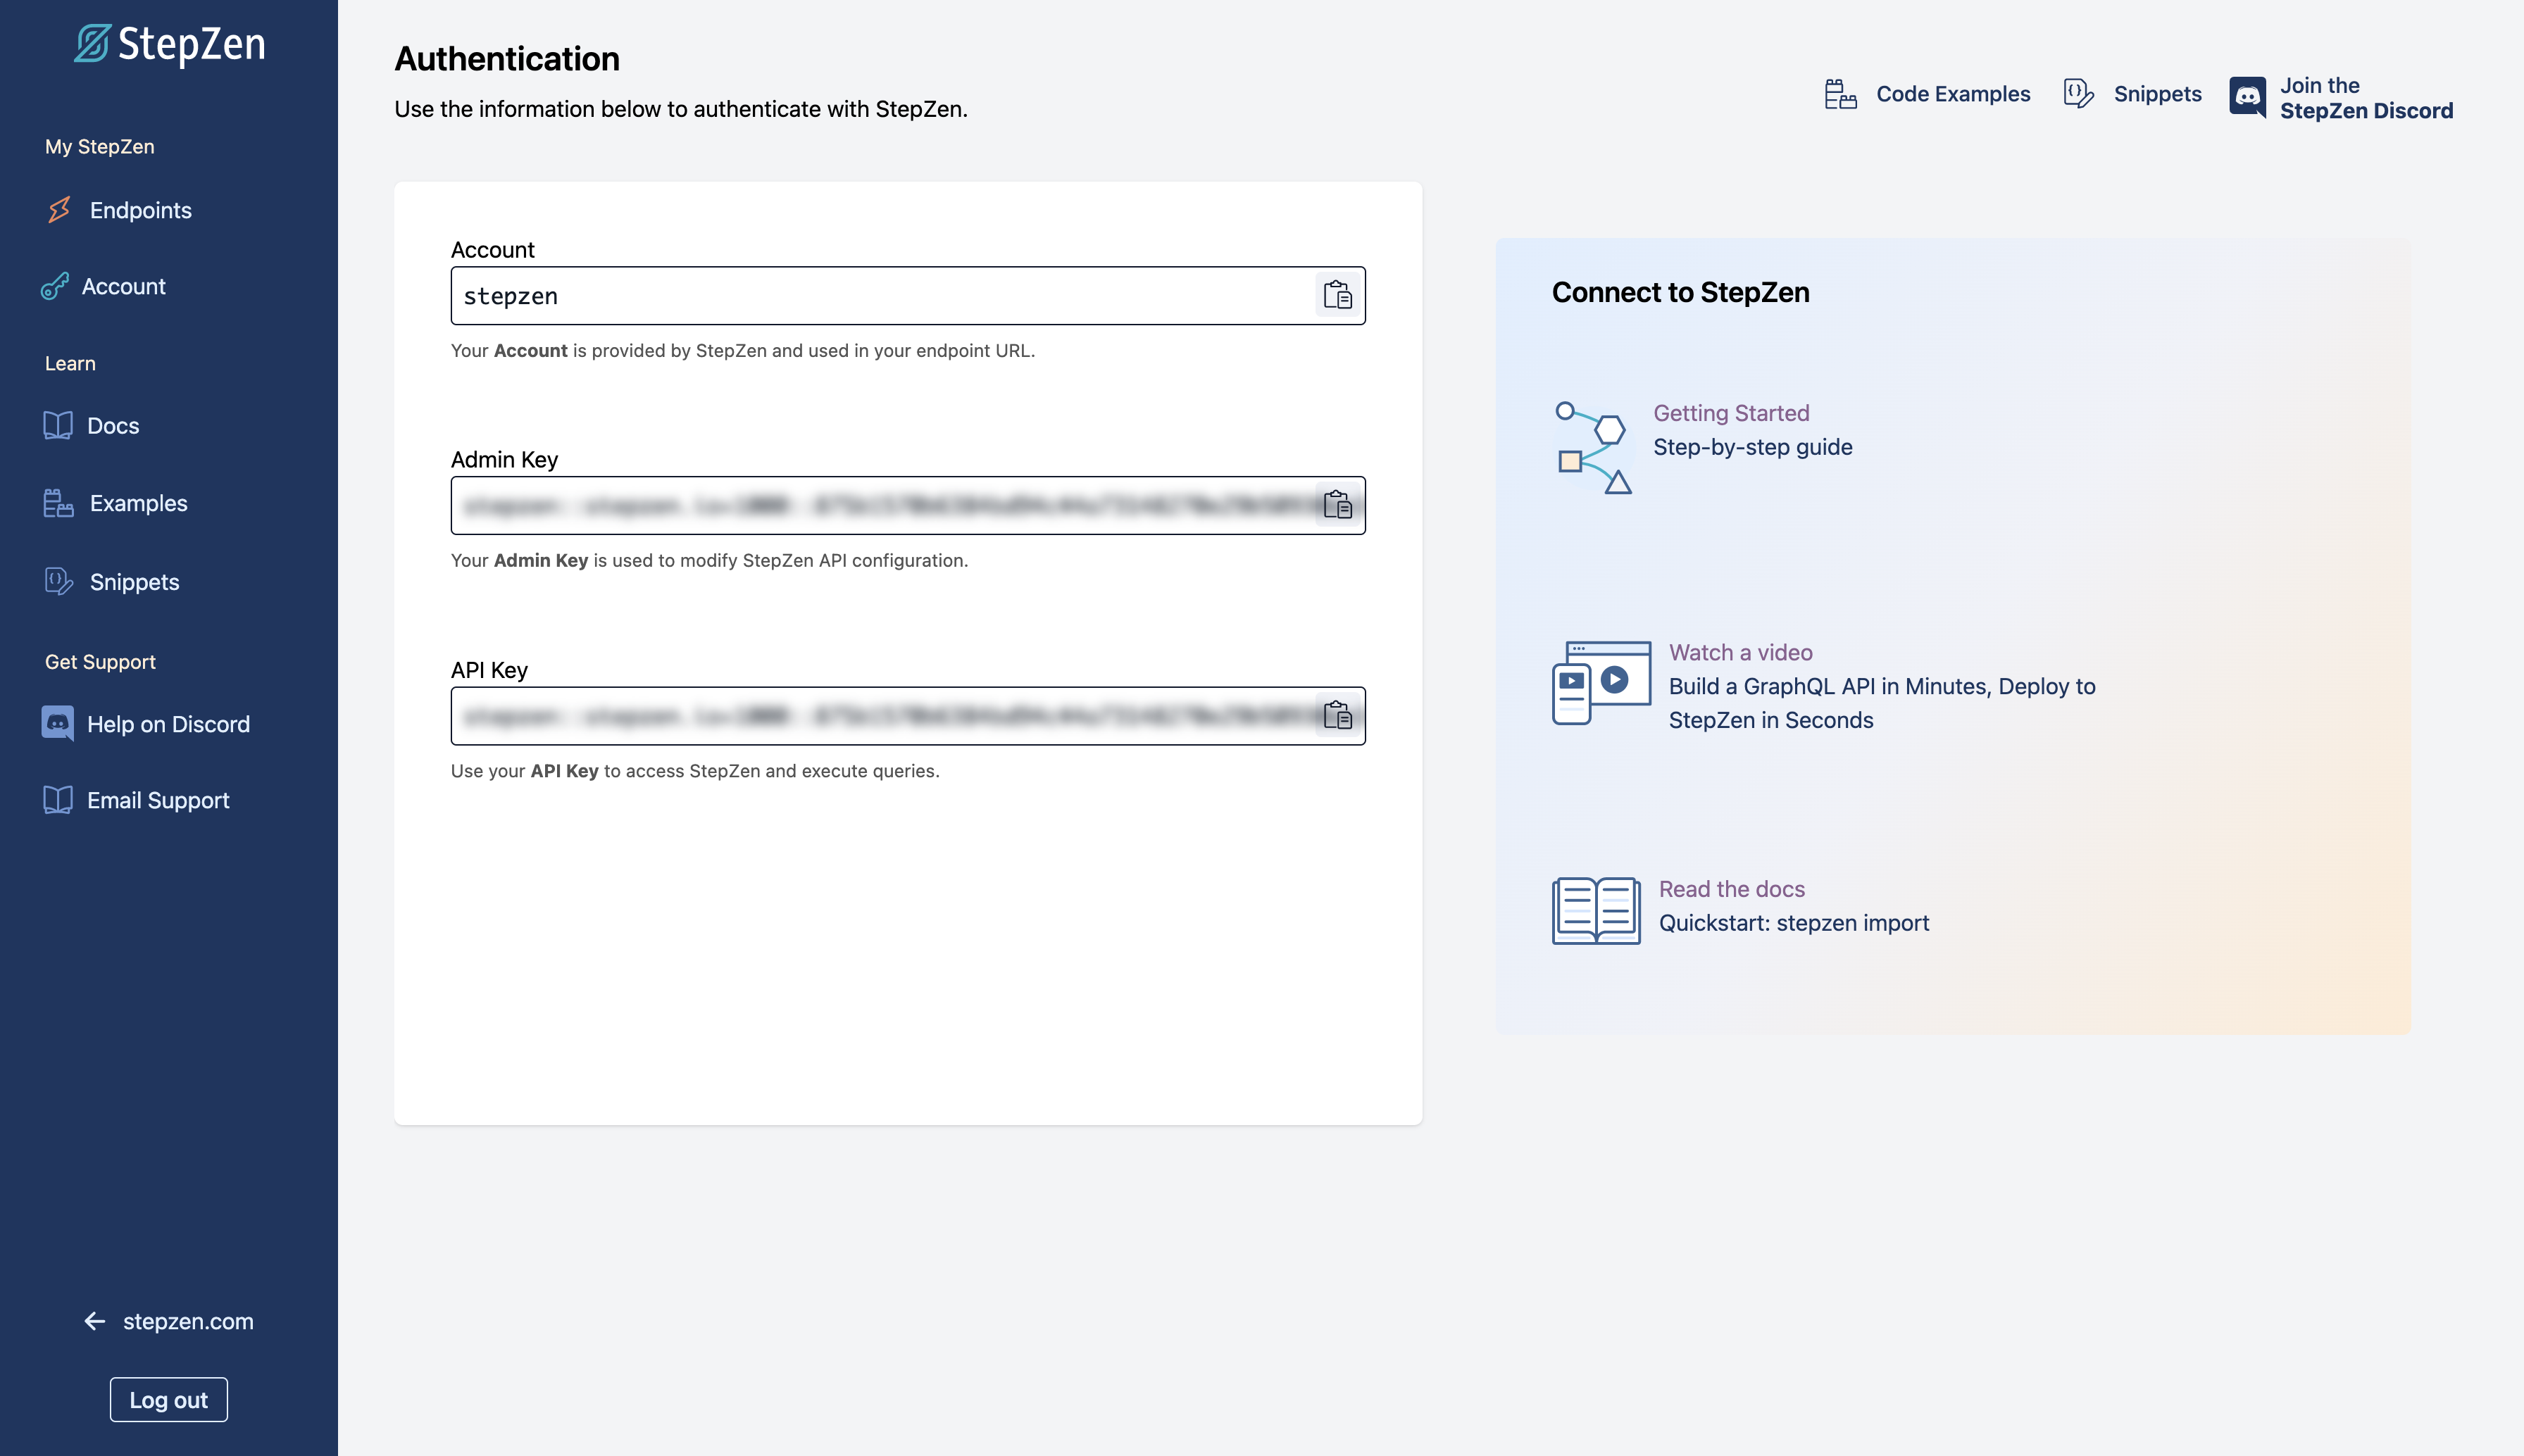
The Account page has your StepZen account details, including account name, API and Admin keys. Also check out some additional resources on this page to help you along your StepZen journey.
Query Samples
We redesigned the query samples to help developers easily build queries for StepZen endpoints. If you have already deployed a StepZen endpoint and want to generate a query, select the "meatball menu" (three dots) associated with an endpoint, and then select "Connect" to generate code samples.

StepZen then introspects your endpoint and a new page is displayed with a query sample in three languages, JavaScript, cURL, and Python. Whether or not your query has arguments, a GraphQL query can be provided to you. Input your arguments, copy and paste one of the three code samples, and embed it into your application!
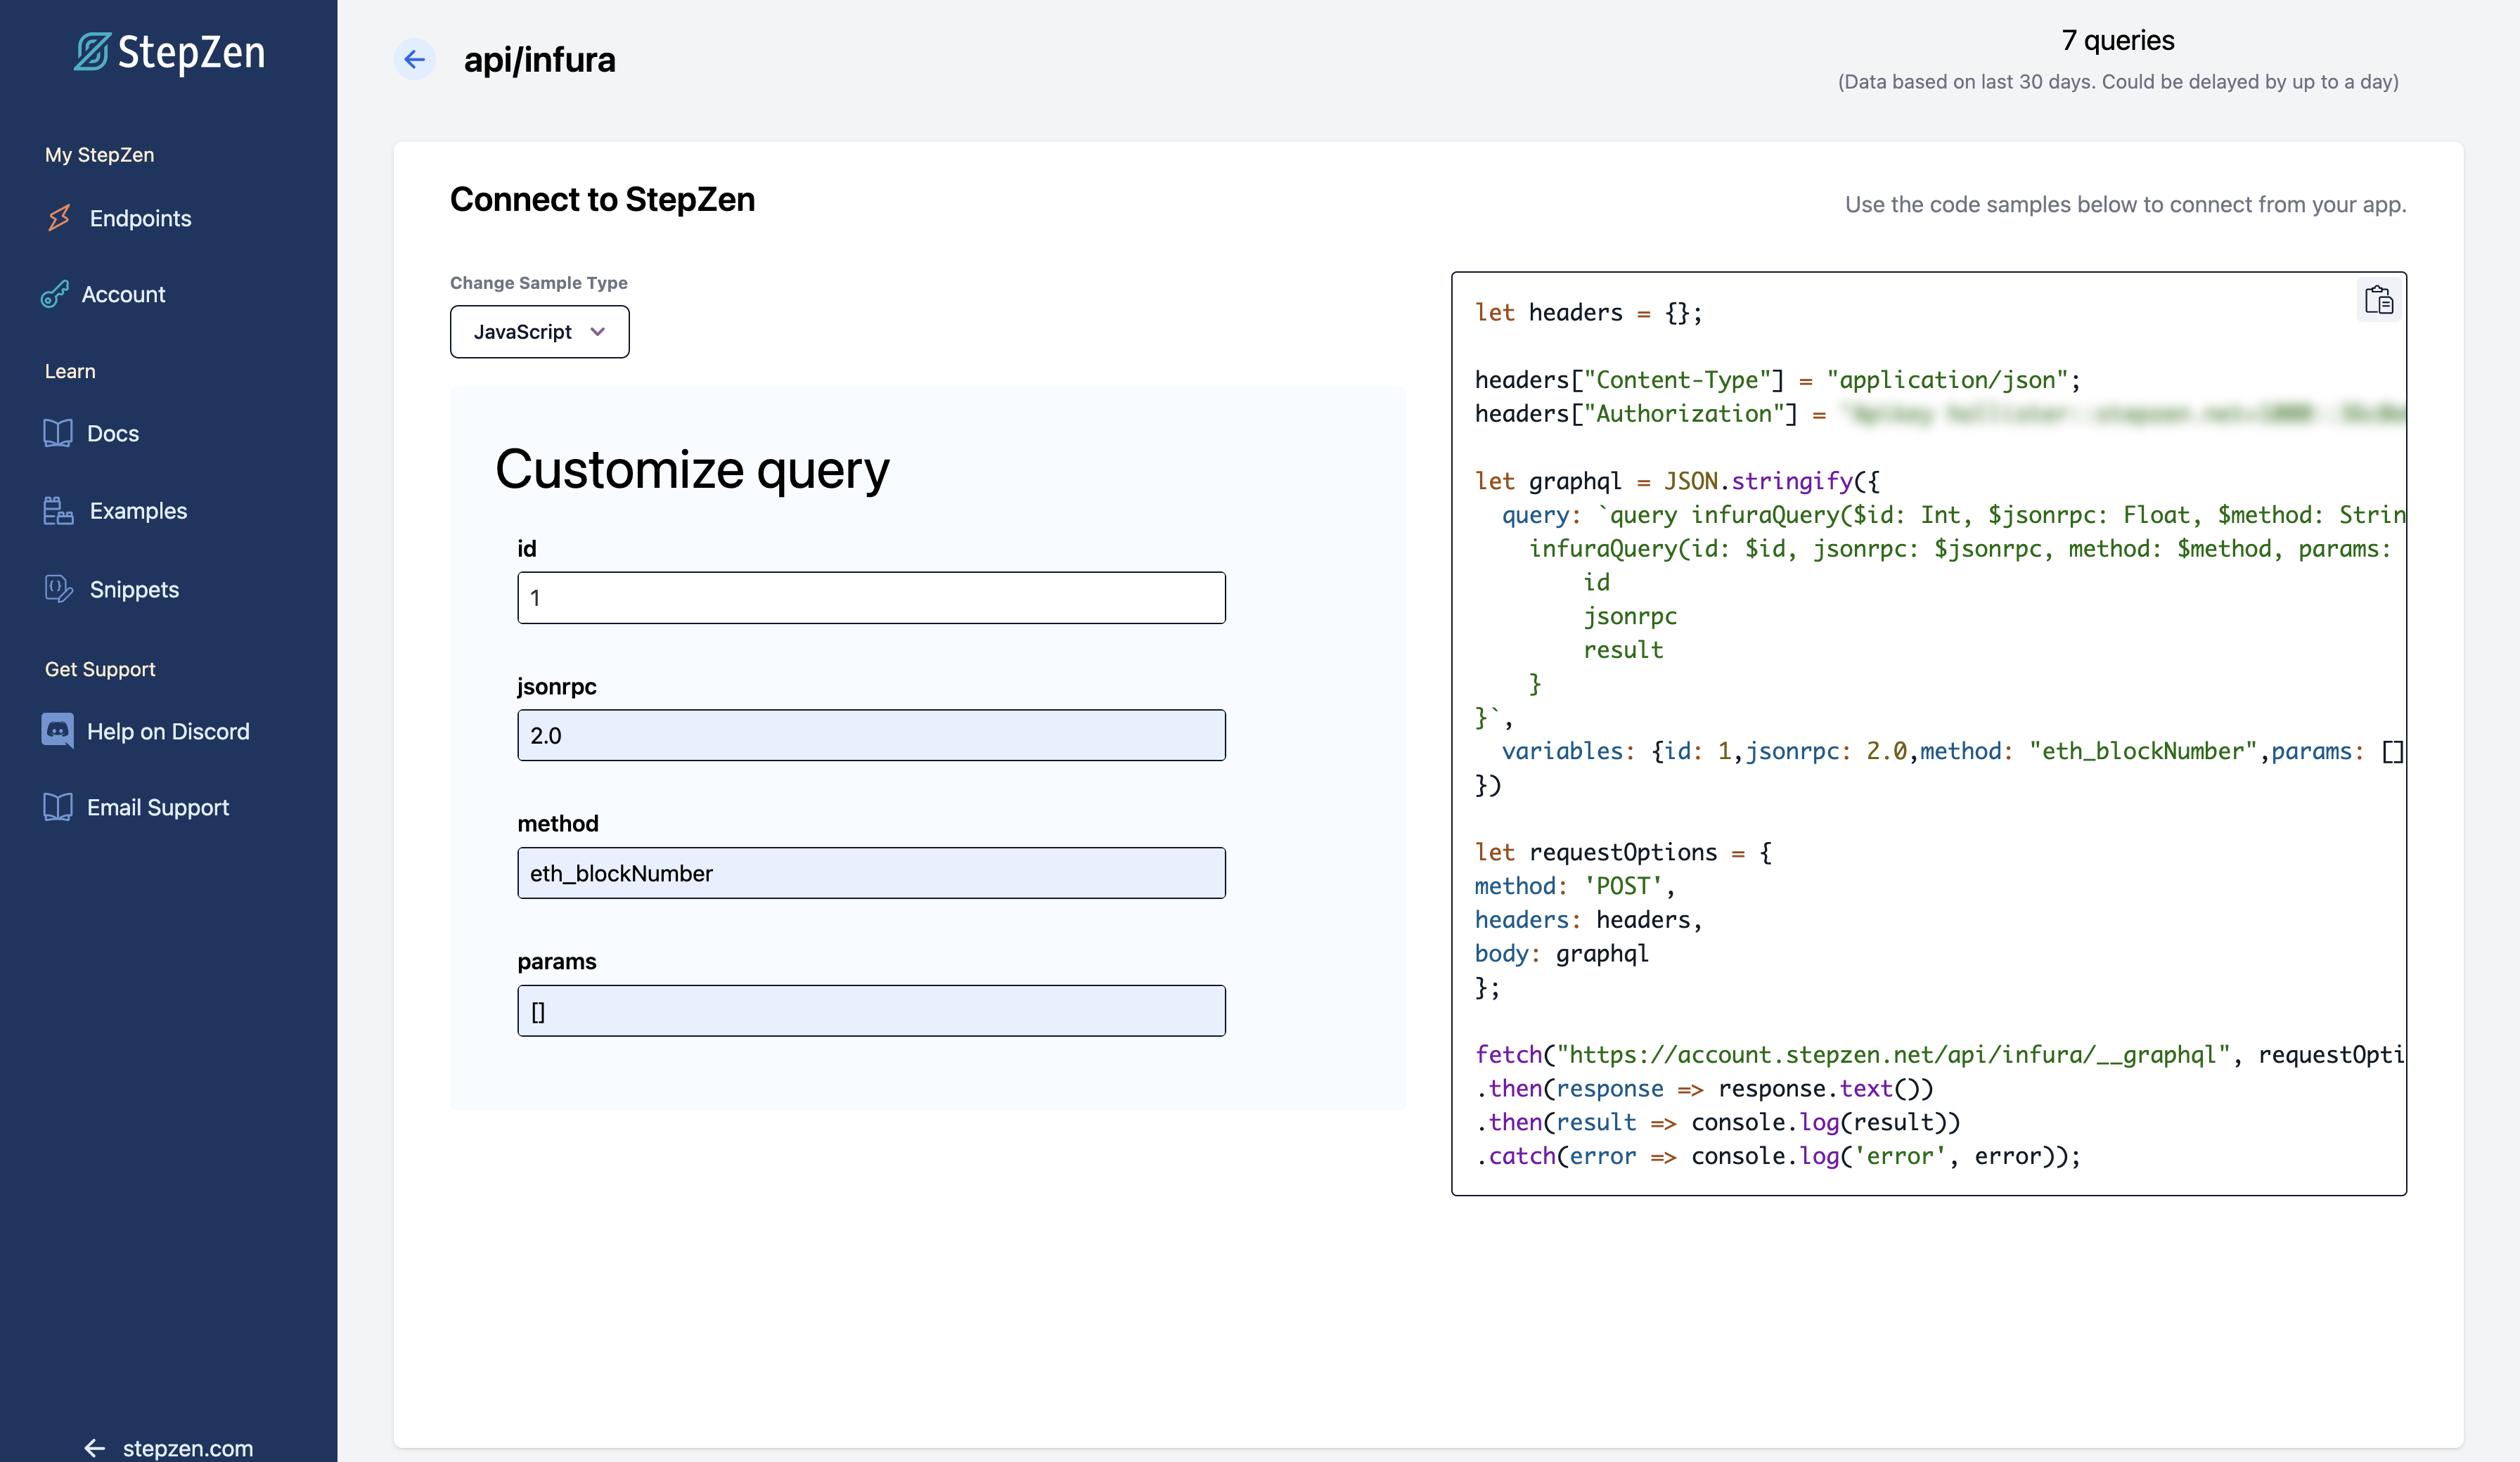
Note: For security reasons, all GraphQL arguments you input into the code samples are not stored in the StepZen dashboard. For this reason when you refresh the page, you must enter all variables again.
Roadmap
The GraphQL data layer is a powerful tool for better application performance and quality assurance. A debugging process within the dashboard is on our roadmap. Our goal is to make the development flow even easier before by providing debugging and logging tools connected to each endpoint.
Follow us on Twitter to stay updated about our latest developments. Reach out to us on Discord with feedback, questions, enhancement requests, or just to brainstorm and chat about what you're building.

